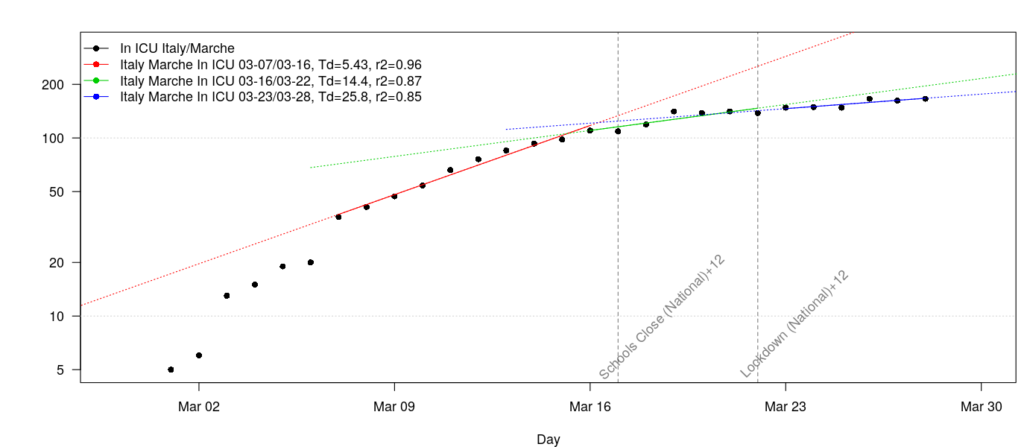
At DataWorks, we have published a simple tool to visualize COVID-19 trends, based on data collected by local and national authorities, The New York Times, and the Human Data Exchange (see the tool for the full data set and links to sources).
Click here to launch the tool. Its use is simple:
- Visualize data from around the world about confirmed cases and fatalities over time. For some countries, hospitalized patients and ICU patients are also available. To visualize data, choose the country and possibly a subdivision of the country (state, region, province, etc.), select a date range, and click “Add Data.” Multiple data sets can be added to the plot.
- You can select between total and daily counts. Total counts are more suited for fitting to exponential models and thus estimate the current growth rate of an outbreak. At some point, (and, we hope, soon) exponential growth will gives way to slower growth and, eventually, to a decrease in daily cases and fatalities. At this point, exponential models are no longer useful, and graphs of daily counts give a better idea of how things are going.
- Fit exponential growth models to data. The exponential growth model provides an estimate of the doubling time, that is, the number of days over which a given measure is expected to double. To fit a model, click “Build Model,” then click on the first point of the data range you want to fit. As you hover on other points in the same data sets, the best fit is shown in real time, together with a 95% confidence band. Click on another point in the same data set to finalize the model. The doubling time is shown in the legend. You can add multiple models to the same plot, for example to investigate possible changes in growth trends.
- Identify the data and case/fatality number anywhere on the graph. Just hover on a data point and read out its information in the message box at the top left.
These capabilities are illustrated by the graph below, showing how social distancing measures have slowed down the growth of the epidemic in the Marche region of Italy, from doubling ICU patients 5 days, to every 14 days after a nationwide school closure, to every 26 days after a nationwide lockdown
